Use Cases for SETLyze
This document describes some possible use cases which describe how SETLyze can be used to find answers to biological questions regarding the settlement of species on SETL-plates.
Use Case 1: Spot Preference
Research Question
“Do species of the genus Obelia have a preference for specific locations on SETL-plates?”
Performing the analysis
Analysis “Spot preference” was designed to analyse a species’ preference for a specific location on a SETL-plates.
For this analysis, we can define the following hypotheses:
- Null hypothesis
- The species in question settles at random areas of SETL-plates.
- Alternative hypothesis
- The species in question has a preference for a plate area (observed mean > expected mean) or has a rejection for a plate area (observed mean < expected mean).
The analysis uses the P-value to decide which hypothesis is true.
- P >= alpha level
- Assume that the null hypothesis is true.
- P < alpha level
- Assume that the alternative hypothesis is true.
To find an answer to the research question, we’re going to run the analysis on all species of the genus Obelia from all available locations.
Start SETLyze, and from the main window select “Analysis 1”. Then click the OK button to start the selected analysis. The Locations Selection dialog will now show up. If this is your first time running SETLyze, then the list of locations will be empty. Clicking the “Load Data” button opens the Load Data dialog. Use this dialog to load your SETL data. For this example, we’ll use the test data provided with SETLyze.
Note
On Windows, the test data can be found in the sub folder “test-data” of the
directory to where you installed SETLyze (e.g.
C:\Program Files\GiMaRIS\SETLyze\test-data\).
On Linux, the “test-data” folder can be found in the source package.
Once the SETL data is loaded, you should see a list of all locations. You can now select the locations from which you want to select species. For this example, we want to use all data available for the genus Obelia, so we’ll select all locations. Select a location and then press Ctrl+A to select all locations. Press the Continue button.
The Species Selection dialog should now be displayed. By default, the species are sorted by their scientific name. Scroll down until you find the species who’s name start with Obelia. You should find the following six species:
- Obelia not geniculata
- Obelia geniculata
- Obelia dichotoma
- Obelia longissima
- Obelia bidentata
- Obelia sp.
Select all six species by holding down the Shift key. Then press the Continue button.
The Define Plate Areas dialog should now be displayed. This dialog allows you to define the SETL-plate areas for the Chi-squared test. The result of the Chi-squared test for this analysis is only useful if you have large amounts of data for the species you’re analyzing. Because the Wilcoxon test for this analysis gives more specific information about the plate areas, we’ll focus on that instead. So we’ll skip the details of this dialog, and leave the default plate areas setting for the Chi-squared test. Press the Continue button to start the calculations for this analysis.
In a few seconds you should be presented with the Analysis Report dialog. This dialog shows the results for the analysis. For this example, we’ll skip the results of the Chi-squared test, and focus on the results of the Wilcoxon tests.
Results
You should see two sections for the results of the Wilcoxon test:
- Wilcoxon rank sum test with continuity correction
- Wilcoxon rank sum test with continuity correction (repeated)
Click on both sections to reveal the results. You should see something similar to the screenshot below.
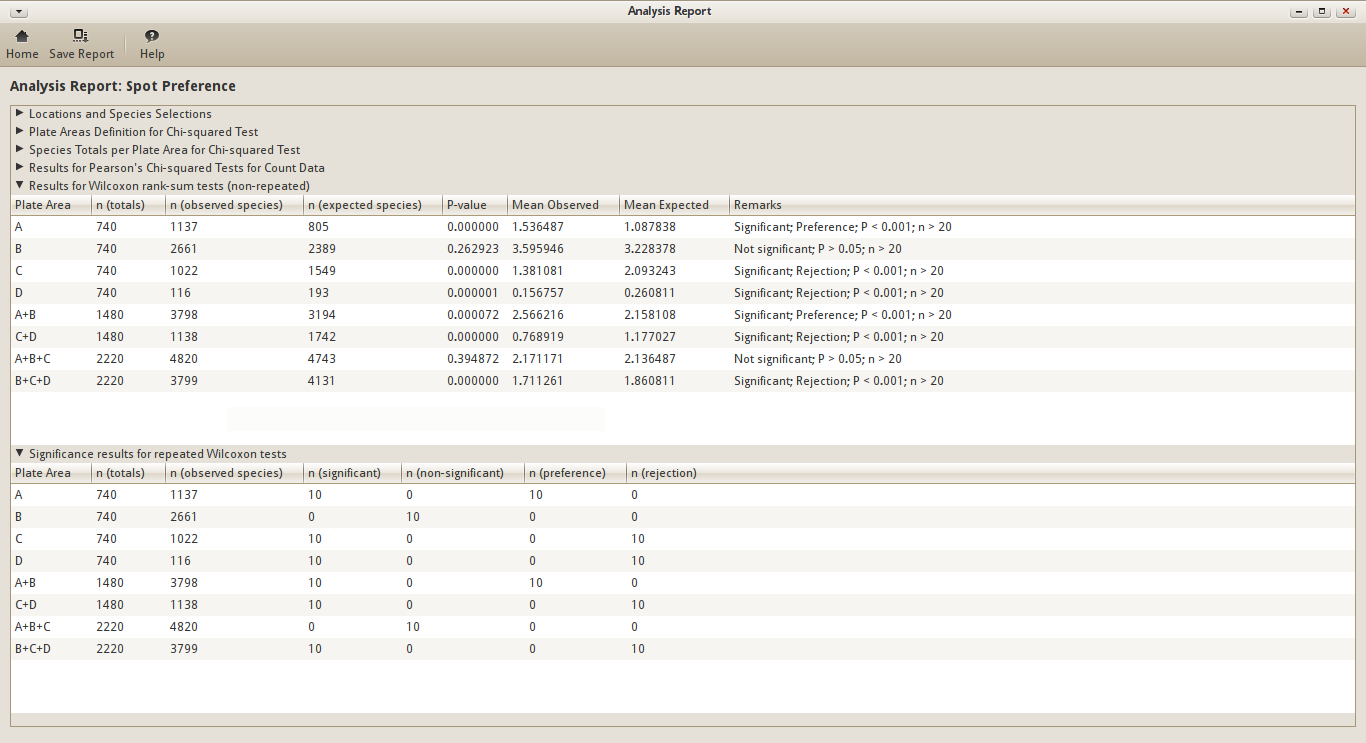
Analysis Report for Use Case 1
Let’s first look at the results of the non-repeated tests. You can see that there seems to be a strong preference for the corners of a SETL-plate (see Default plate areas for an overview of the plate areas). I say strong, because the P-value is very low (P < 0.1%). At the same time, this species seems to reject the middle areas of the plates (areas C and D). There is no significance for area B, so it makes sense that the combination A+B returns significant preference. This significance is caused by area A, and not B. The same can be said for B+C+D. The significance is caused by the areas C+D. Area A+B+C returns non-significant. This is because both A and C have a significance, but in the opposite directions. B has again no influence because it’s not significant.
Remember that these are the results of the non-repeated tests. The results with very low P-values are pretty solid, even though the expected values were calculated randomly. But this cannot be said for P-values that are close to the alpha level (5% by default). In that case the significance result could be a coincidence. This is why the results of repeated tests are included as well.
The Wilcoxon test was repeated a number of times. And before each repeat, the expected values are re-calculated. By default, the number of repeats is set to 10.
Let’s have a look at the results of the repeated tests. If you look at the repeat results for plate area A, you’ll see that out of 10 repeats, 10 were found to be significant (P < 5%). And out of these 10 significant results, all 10 showed a preference for the area. Based on this result, we can almost safely say that the results we found are not a coincidence. I say almost, because a total of 10 repeats is very low. To be even more sure, you can set the number of repeats to a higher value in the Preferences dialog.
Conclusion
The species of the genus Obelia have a strong preference for the corners (area A) of SETL-plates, and a strong rejection for the middle (areas C+D) of SETL-plates. The species don’t seem to have a preference for the borders (area B).
Use Case 2: Attraction of Species (intra-specific)
Research Question
“Does Balanus crenatus from the location Aquadome Grevelingen attract individuals of its own kind?”
Performing the analysis
Analysis “Attraction of Species (intra-specific)” can be used to determine if a species attracts or repels individuals of its own kind.
For this analysis, we can define the following hypotheses:
- Null hypothesis
- The species in question settles at random areas of SETL-plates, unregarded the presence of other individuals of its own kind.
- Alternative hypothesis
- The species attracts (observed mean < expected mean) or repels (observed mean > expected mean) individuals of its own kind.
The analysis uses the P-value to decide which hypothesis is true.
- P >= alpha level
- Assume that the null hypothesis is true.
- P < alpha level
- Assume that the alternative hypothesis is true.
To find an answer to this research question, we’re going to run the analysis on Balanus crenatus from the location Aquadome Grevelingen.
Start SETLyze, and from the main window select analysis “Attraction within Species”. Then click the OK button to start the selected analysis. The Locations Selection dialog will now show up. If this is your first time running SETLyze, then the list of locations will be empty. Clicking the “Load Data” button opens the Load Data dialog. Use this dialog to load your SETL data. For this example, we’ll use the test data provided with SETLyze.
Note
On Windows, the test data can be found in the sub folder “test-data” of the
directory to where you installed SETLyze (e.g.
C:\Program Files\GiMaRIS\SETLyze\test-data\).
On Linux, the “test-data” folder can be found in the source package.
Once the SETL data is loaded, you should see a list of all locations. You can now select the locations from which you want to select species. For this example, we’re just interested in data from the location Aquadome Grevelingen. Select “Aquadome, Grevelingen” from the list. Press the Continue button.
The Species Selection dialog should now be displayed. By default, the species are sorted by their scientific name. Select the species “Balanus crenatus”. Press the Continue button to start the calculations for this analysis.
In a few seconds you should be presented with the Analysis Report dialog. This dialog shows the results for the analysis.
Results
For this analysis, two different statistical hypothesis tests are performed; the Wilcoxon rank-sum test and Pearson’s Chi-squared test. The following sections should be present in the report dialog:
- Wilcoxon rank sum test with continuity correction
- Wilcoxon rank sum test with continuity correction (repeated)
- Chi-squared test for given probabilities
Let’s first have a look at the results of the Wilcoxon tests. Click on both Wilcoxon sections to reveal the results. You should see something similar to the screenshot below.
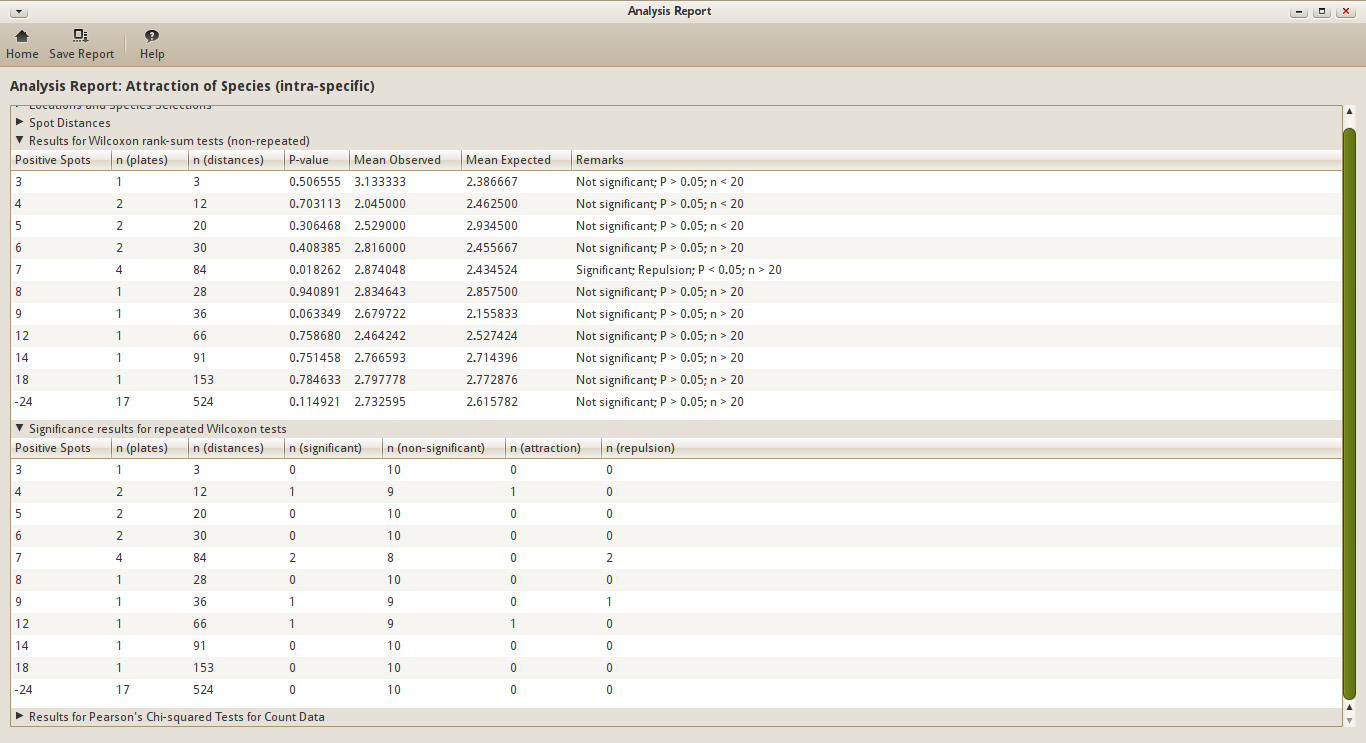
Analysis Report for Use Case 2 - Wilcoxon tests
Let’s first look at the results of the non-repeated tests. You’ll see that most results are non-significant. There might be a few exceptions, but these could have other causes then attraction/repuslion. For example, some parts of the SETL-plates might be coverd with another species, making it simply impossible for Balanus crenatus to settle there.
So these are the results of the non-repeated tests. The results with very low P-values are pretty solid, even though the expected values were calculated randomly. But this cannot be said for P-values that are close to the alpha level (5% by default). In that case the significance result could be a coincidence. This is why the results of repeated tests should be taken into account as well.
The Wilcoxon test was repeated a number of times. And before each repeat, the expected values are re-calculated. By default, the number of repeats is set to 10.
Let’s have a look at the results of the repeated tests. Notice that sometimes the test does return significant. If you however find that the test returns non-significant far more often than significant, you could conclude that there is no significance, and therefor assume that the null hypothesis is true.
Then there are the results of the Chi-squared tests. While the Wilcoxon test looks at the distribution of spot distances (the measurements), the Chi-quared test looks at the frequencies at which spot distances occur. The observed frequencies are being compared to the expected frequencies. This again leads to P-values which can be used to determine which hypothesis is true. Because the expected values are fixed, repeats aren’t necessary for this test.
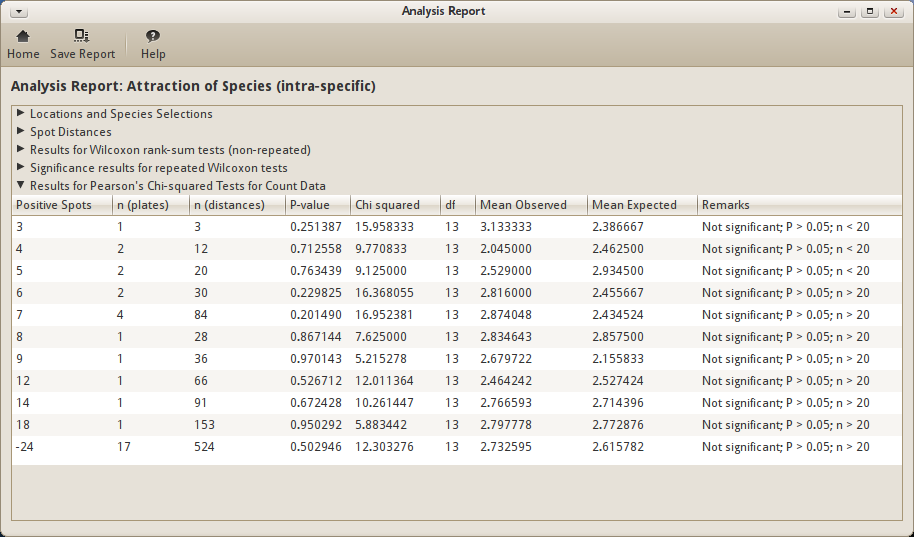
Analysis Report for Use Case 2 - Chi-squared tests
In this case, the Chi-squared test gives similar results to the Wilcoxon test. It turns out however that this method is less sensitive to differences in samples.
Conclusion
Balanus crenatus doesn’t seem to attract or repel individuals of its own kind.